
The Doji Breakout forex trading strategy is designed for traders who’ll love to combine price action with simple trading indicators.
This strategy is suitable for both beginners and experienced traders and can be applied on any currency pair.
Learn the simple, yet profitable trading rules below:
Chart Setup
MetaTrader4 Indicators: breakout-zones.ex4 (Default Setting), doji_arrows.ex4 (Default Setting), CCI-Histogram.ex4 (Input Variable Modified; A_Period=100, num_bars=50000000)
Preferred Time Frame(s): 1-Minute, 5-Minute, 15-Minute, 30-Minute, 1-Hour, 4-Hour, 1-Day
Recommended Trading Sessions: Any
Currency Pairs: Any pair
Download
Download the Doji Breakout Forex Trading Strategy
Buy Trade Example
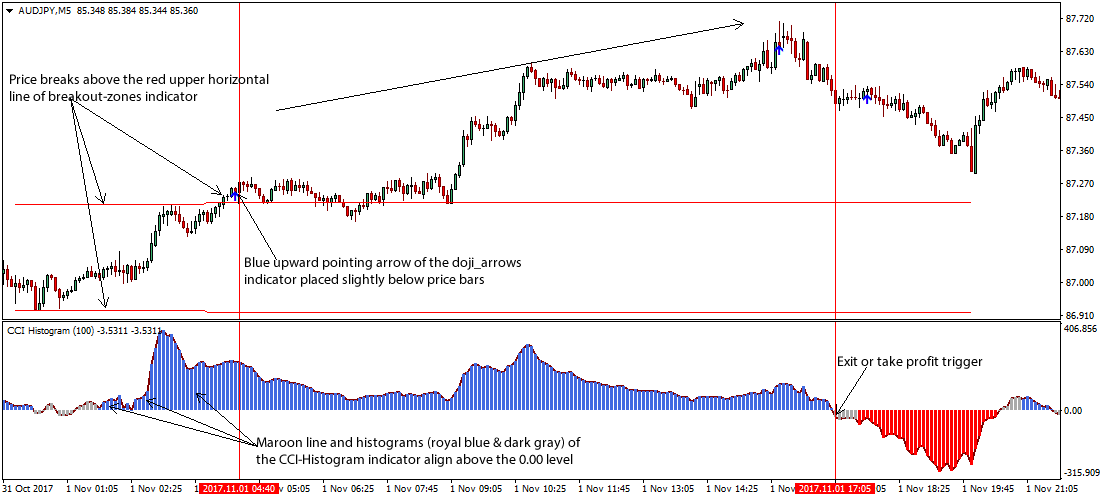
Fig. 1.0
Strategy
Long Entry Rules
Enter a buy order if the following indicator or chart pattern gets put on display:
- If price breaks above the red upper horizontal line of the breakout-zones custom indicator as seen on Fig. 1.0, price is said to be taken higher, hence a signal to buy the selected currency pair.
- If the blue upward pointing arrow of the doji_arrows.ex4 custom indicator gets sighted slightly below the candles as shown on Fig. 1.0, price is said to be taken higher i.e. a trigger to buy the designated forex pair.
- If the maroon line and histograms (royal blue & dark gray) of the CCI-Histogram custom indicator gets aligned above the 0.00 level as depicted on Fig. 1.0, a buy signal is said to be in place.
Stop Loss for Buy Entry: Place stop loss below support.
Exit Strategy/Take Profit for Buy Entry
Exit or take profit if the following rules or conditions takes precedence:
- If price breaks below the red lower horizontal line of the breakout-zones custom indicator while a buy signal is ongoing, an exit or take profit is advised.
- If while a buy signal is running, the red downward pointing arrow of the doji_arrows.ex4 custom indicator pops up somewhat above price bars, an exit or take profit is recommended.
- If the maroon line and probably the dark gray histogram of the CCI-Histogram custom indicator break below the 0.00 level while a buy signal is ongoing, an exit or take profit is in the cards.
Sell Entry Rules
Enter a sell order if the following holds true:
- If price breaks below the red lower horizontal line of the breakout-zones custom indicator as illustrated Fig. 1.1, price is said to be pushed lower, hence a signal to sell the designated forex pair.
- If the red downward pointing arrow of the doji_arrows.ex4 custom indicator takes positions somewhat above the candles as depicted on Fig. 1.1, price is said to be driven lower, hence a sell alert.
- If the maroon line and histograms (red & dark gray) of the CCI-Histogram custom indicator gets aligned below the 0.00 level (refer to Fig. 1.1), a sell signal is said to be in place.
Stop Loss for Sell Entry: Place stop loss above resistance.
Exit Strategy/Take Profit for Sell Entry
Exit or take profit if the following takes center stage:
- If price surges above the red upper horizontal line of the breakout-zones custom indicator during a sell signal, an exit or take profit will suffice.
- If while a buy signal is running and the blue upward pointing arrow of the doji_arrows.ex4 custom indicator pops up fairly below price bars, an exit or take profit is advised.
- If the maroon line and probably the dark gray histogram of the CCI-Histogram custom indicator break above the 0.00 level during a sell signal, an exit or take profit is in the offing.
Sell Trade Example
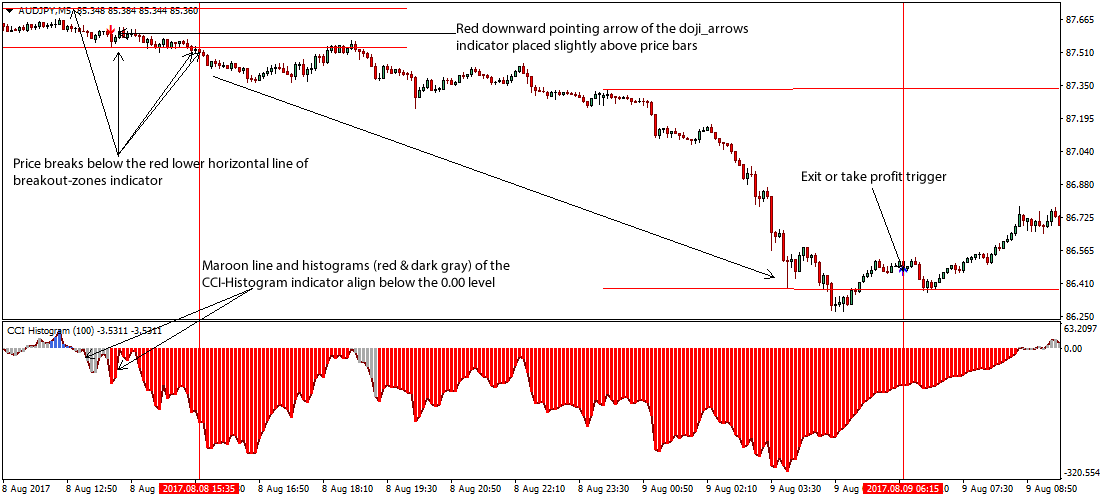
Fig. 1.1
Free Download
Download the Doji Breakout Forex Trading Strategy
The breakout-zones.ex4 custom indicator draws medium term support and resistance lines on the chart window.
The CCI_Histogram.ex4 is one of the variant of the Commodity Channel Index (CCI) that gauges the current price level in relation to a mean price level over a specified time period.
The doji_arrows.ex4 custom indicator is a technical analysis tool that is used to spot the doji candlestick formation.