
The Half 1.02 MACD Forex Trading Strategy is a simple trend following trading strategy that works.
Two unique, yet simple technical indicators makes up this system i.e. the MACD, a well know oscillator, teams up with the HalfTrend-1.02 custom indicator (a technical tool used in defining how far a trend will go), to yield a modest and an impressive trading strategy.
Chart Setup
MetaTrader4 Indicators: HalfTrend-1.02.ex4 (Inputs Variable Modified; Amplitude=4), MACD.ex4 (Default Setting)
Preferred Time Frame(s): 1-Minute, 5-Minute, 15-Minute, 30-Minute, 1-Hour, 4-Hour, 1-Day
Recommended Trading Sessions: Any
Currency Pairs: Any pair
Download
Download the Half 1.02 MACD Forex Trading Strategy
Buy Trade Example
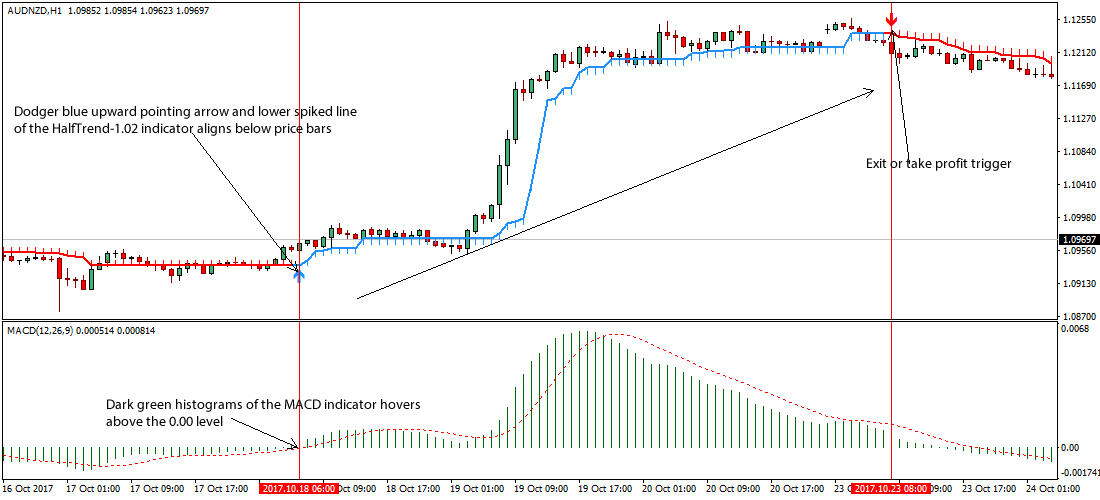
Fig. 1.0
Strategy
Long Entry Rules
Enter a buy order if the following rules or conditions hold sway:
- If the dodger blue upward pointing arrow that is slightly attached to the lower spiked line of the HalfTrend-1.02 custom indicator gets aligned fairly below the candlesticks (see Fig. 1.0), a bullish signal is said to be on the horizon.
- If the dark green histograms of the MACD indicator hovers above the 0.00 level as seen on Fig. 1.0, it is an indication of a likely bullish pressure, as such a buy signal is advised.
Stop Loss for Buy Entry: Place stop loss below trading support.
Exit Strategy/Take Profit for Buy Entry
Exit or take profit if the following rules or conditions takes center stage:
- If while a buy signal is ongoing, the HalfTrend-1.02 custom indicator displays a red downward pointing arrow that is aligned slightly above price bars, it is a trigger to exit or take profit at once.
- If a dark green histogram forms below the 0.00 level during a bullish trend, it is a signal to exit or take profit without delay.
Sell Entry Rules
Enter a sell order if the following holds true:
- If the red downward pointing arrow that is slightly attached to the upper spiked line of the HalfTrend-1.02 custom indicator gets aligned fairly above the candlesticks as depicted on Fig. 1.1, a bearish signal is said to be on the horizon.
- If the dark green histograms of the MACD indicator hovers below the 0.00 level as seen on Fig. 1.1, it is an indication of a probable bearish trend, as such a sell signal is advised.
Stop Loss for Sell Entry: Place stop loss above trading resistance.
Exit Strategy/Take Profit for Sell Entry
Exit or take profit if the following takes center stage:
- If while a sell signal is running, the HalfTrend-1.02 custom indicator displays a dodger blue upward pointing arrow that is aligned slightly below the candles, it is a trigger to exit or take profit at once.
- If a dark green histogram readjust to form above the 0.00 level during a bearish trend, it is a signal to exit or take profit forthwith.
Sell Trade Example
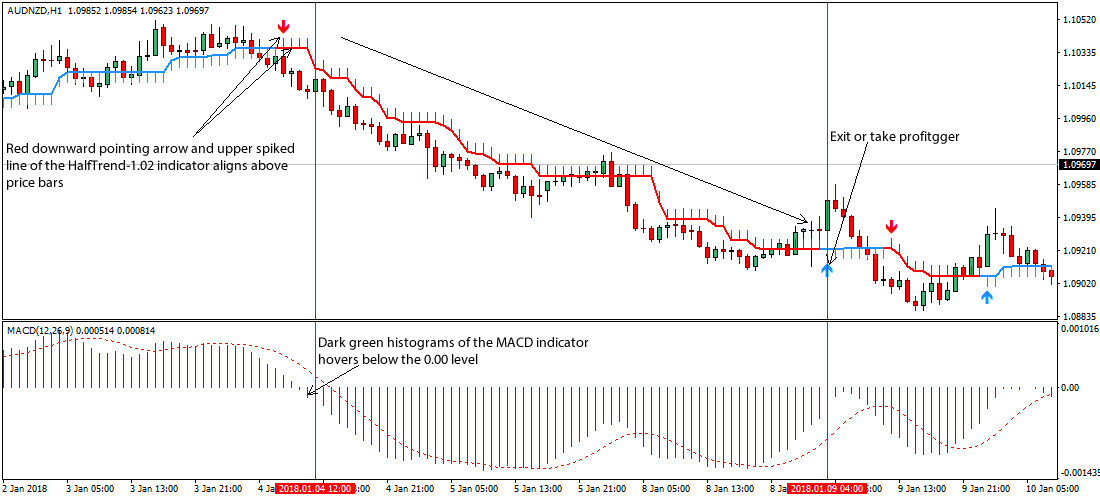
Fig. 1.1
Free Download
Download the Half 1.02 MACD Forex Trading Strategy
About The Trading Indicators
The HalfTrend-1.02 custom indicator defines reversal within the market, and it does so by combining an upward dodgerblue upward facing arrow along with a downward spiked line place below price bars to signal a buy, while a downward pointing red arrow with an upward spiked line aligned above price signals a sell.
The Moving average convergence divergence (MACD) on the other hand is a trend-following momentum indicator that reveals the connection between two moving averages of price.