
Participants in the forex market include everyone from big banks and financial establishments to retail investor.
The entire process entails trading currencies directly from other currencies in the marketplace.
Consequently, we find ourselves in a situation that leaves currencies being priced in relation to other currencies i.e. Euro versus British Pound, United States Dollar or Japanese Yen.
The Optimum Channel Index forex trading strategy is designed to forecast the increases or decreases in price, thereby allowing market enthusiasts some returns on investment.
The three technical tools that makes up the strategy includes the i-AMA-Optimum for scanning trends, channel-trading-signals for checking up on volatility and the Average Directional Movement Index helps determine the strength of the trend in question.
Chart Setup
MetaTrader4 Indicators: i-AMA-Optimum.ex4 (Default Setting), channel-trading-signals.ex4 (Colors Modified; #1=None, #2=None, #3=None, #4=None, #5=None, #6=None), Average Directional Movement Index.ex4 (Parameters Modified; Period=28)
Preferred Time Frame(s): 1-Minute, 5-Minute, 15-Minute, 30-Minute, 1-Hour, 4-Hour, 1-Day
Recommended Trading Sessions: Any
Currency Pairs: Any pair
Download
Download the Optimum Channel Index Forex Trading Strategy
Buy Trade Example
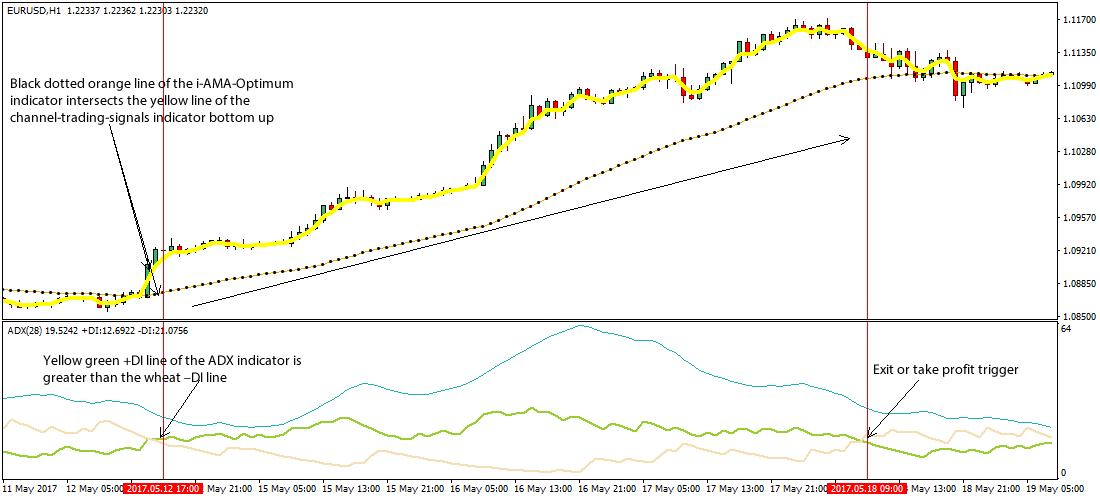
Fig. 1.0
Strategy
Long Entry Rules
Initiate a buy entry if the following indicator or chart pattern gets put on display:
- If the black dotted orange line of the i-AMA-Optimum custom indicator intersects the yellow line of the channel-trading-signals indicator in a bottom up manner as seen on Fig. 1.0, a buy signal is looming.
- If the yellow green +DI line is greater than the wheat –DI line of the ADX MT4 indicator as seen on Fig. 1.0, price is said to be pushed slightly higher i.e. a signal to go long on the selected forex pair.
Stop Loss for Buy Entry: Place stop loss below the rising black dotted orange line.
Exit Strategy/Take Profit for Buy Entry
Exit or take profit if the following rules or conditions takes center stage:
- If closes below the black dotted orange line of the i-AMA-Optimum custom indicator during a buy signal, it is a trigger exit or take profit at once.
- If the wheat –DI line crosses the yellow green +DI line of ADX indicator to stay above as shown on Fig. 1.0, an exit or take profit is recommended.
Sell Entry Rules
Enter a sell order if the following holds true:
- If the black dotted orange line of the i-AMA-Optimum custom indicator overlaps the yellow line of the channel-trading-signals indicator in a top downward fashion as depicted on Fig. 1.1, a sell signal is believed to be imminent.
- If the wheat –DI line is greater than the yellow green +DI line of the ADX MT4 indicator as illustrated on Fig. 1.1, price is said to be driven lower i.e. a sell market alert.
Stop Loss for Sell Entry: Place stop loss above the falling black dotted orange line.
Exit Strategy/Take Profit for Sell Entry
Exit or take profit if the following takes center stage:
- If price closes above the black dotted orange line of the i-AMA-Optimum custom indicator as seen on Fig. 1.1, an exit or take profit is advised.
- If the wheat –DI line gets aligned below the yellow green +DI line of ADX indicator while a sell signal is ongoing, an exit or take profit will suffice.
Sell Trade Example

Fig. 1.1
Free Download
Download the Optimum Channel Index Forex Trading Strategy
About The Trading Indicators
The i-AMA-Optimum is an optimized version of the Kaufman’s Adaptive Moving Average (AMA) that was originally developed by Perry Kaufman and finds use on short and long periods.
The channel-trading-signals custom indicator is a moving average indicator that can be used to measure trend.
Developed by Welles Wilder, the average directional index (ADX) is a technical indicator deployed in determining the strength of a trend.
It is typically deployed in a chart window along with two lines identified as the DMI (Directional Movement Indicators).