
In a bid to catch continuation patterns on the activity chart, we have designed a simple forex trading strategy based on the flag pattern along with some basic indicators.
The strategy is quite easy to understand and could be used by both forex beginners and seasoned traders alike.
The flag pattern is one that fancies my interest when spotted due to the explosive moves they produce. This is how the Flag pattern looks like:
Chart Setup
MetaTrader4 Indicators: Super Signal v3.ex4 (Input Variable modified; dist2=40, dist1=40), squeeze_v1.ex4 (default setting)
Preferred Time Frame(s): 1-Minute, 5-Minute, 15-Minute, 30-Minute, 1-Hour, 4-Hour, 1-Day
Recommended Trading Sessions: Any
Currency Pairs: Any pair
Download
Download the Forex Flag Pattern Trading Strategy
Buy Trade Example

Fig. 1.0
Strategy
Long Entry Rules
Initiate a buy entry if the following indicator or chart pattern gets displayed:
- If the “Bull Flag Pattern” is spotted on the activity chart, it signals an uptrend continuation pattern, and we’ll be looking to price to break above the upper trend line.
- If after/before the breakout, a medium orchid upward pointing arrow of the Super Signal v3 custom indicator is sustained below price bars as seen on Fig. 1.0, price is said to be bullish i.e. a buy signal.
- If the medium & dodger blue histograms of the squeeze_v1 custom indicator is formed after a “Bull Flag Pattern” above the 0.00 level, price is said to be pushed to the upside i.e. a buy signal.
Stop Loss for Buy Entry: Place stop loss 2 pips below immediate support.
Exit Strategy/Take Profit for Buy Entry
Exit or take profit if the following rules or conditions takes precedence:
- If a medium orchid downward pointing arrow of the Super Signal v3 custom indicator forms above the candlesticks as seen on Fig. 1.0, it is a trigger to exit or take profit at once.
- If a tomato or orange histogram of the squeeze_v1 indicator forms below the 0.00 level during a buy signal, price is said to be taking a U-turn i.e. an exit or take profit trigger.
Sell Entry Rules
Enter a sell order if the following holds sway:
- If the “Bear Flag Pattern” is spotted on the activity chart, it signals a downtrend continuation pattern as we await price breakout from the lower trend line.
- If after/before the breakout, a medium orchid downward pointing arrow of the Super Signal v3 custom indicator is sustained above price bars as seen on Fig. 1.1, price is said to be bearish i.e. a sell alert.
- If the tomato or orange histograms of the squeeze_v1 custom indicator is formed after a “Bear Flag Pattern” below the 0.00 level, price is said to be pushed to lower i.e. a sell signal.
Stop Loss for Sell Entry: Place stop loss 2 pips above immediate resistance.
Exit Strategy/Take Profit for Sell Entry
Exit or take profit if the ensuing chart patterns gets displayed:
- If a medium orchid upward pointing arrow of the Super Signal v3 custom indicator forms below the candlesticks, it is a trigger to exit or take profit forthwith.
- If a medium & dodger blue histogram of the squeeze_v1 indicator forms above the 0.00 level during a sell trigger, price is said to be taking a U-turn i.e. an exit or take profit trigger.
Sell Trade Example
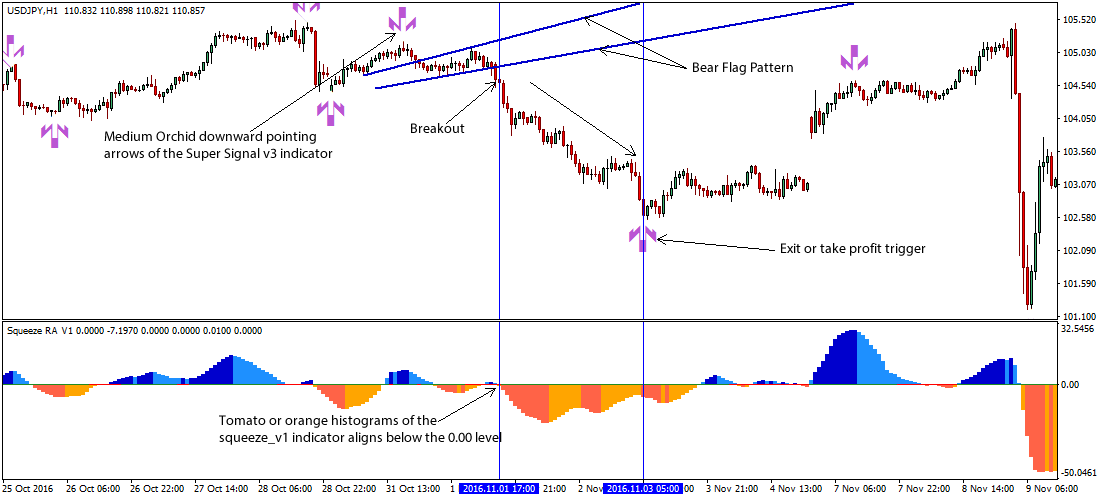
Fig. 1.1
Free Download
Download the Forex Flag Pattern Trading Strategy
About The Trading Indicators
The Squeeze_v1 custom indicator is built on the strategy that was talked about in John Carter’s book, “Mastering the Trade”. It also is an enhanced version of Squeeze_Break.ex4 indicator by Des O’Regan.
The Super Signal v3 custom indicator is trend following indicator that deploys arrows aligned above or below the candlesticks.
The Flag forex pattern is a continuation pattern that is formed just after a bullish or bearish price action trailed by a session of consolidation.