
Trend lines are line tools that are used to link the highest or the lowest prices that are represented on the activity chart.
Their ability to map out zones of support and resistance leads to quick identification of price breakouts.
Moreover, if you add some basic technical indicators to this line tool, what you’ll have is a powerful trend line forex trading strategy with an awesome win rate.
Chart Setup
MetaTrader4 Indicators: MA ribbon filled.89.21 (default settings), LWMA-Crossover_Signal (Input Variable modified; FasterLWMA=30, SlowerLWMA=102)
Preferred Time Frame(s): 1-Minute, 5-Minute, 15-Minute, 30-Minute, 1-Hour, 4-Hour, 1-Day
Recommended Trading Sessions: Any
Currency Pairs: Any pair (majors, crosses, exotics)
Download
Download the Trend Line Break Forex Reversal Strategy
Buy Trade Example
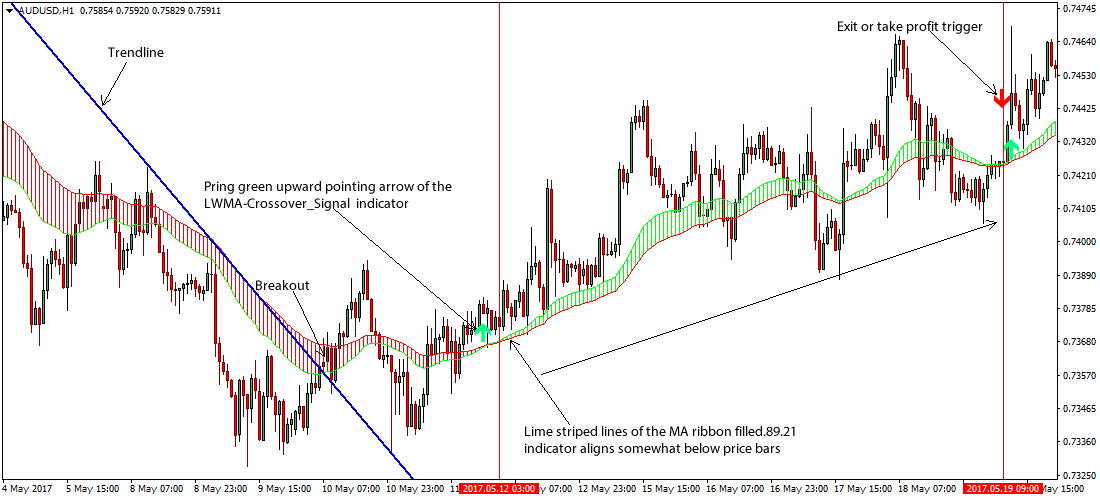
Fig. 1.0
Strategy
Long Entry Rules
Initiate a buy order if the following indicator or chart pattern gets displayed:
- If price breakouts above the trend line as seen on Fig. 1.0, after a sustained resistance, it is pointing to bullish price pressures in the market, but wait for further buy confirmations.
- If the striped lime lines of the MA ribbon filled.89.21 custom indicator forms somewhat below price bars, price is said to be pressured to the upside i.e. a buy signal.
- If the spring green upward pointing arrow of the LWMA-Crossover_Signal.ex4 custom indicator pops up on the activity chart, it is a straight up buy alert.
Stop Loss for Buy Entry: Place stop loss 2 pips below immediate support.
Exit Strategy/Take Profit for Buy Entry
Exit or take profit if the following rules or conditions takes precedence:
- If price retest and breaks below the trend line after a confirmed breakout, it is a clear exit or take profit trigger.
- If the striped lines of the MA ribbon filled.89.21 custom indicator turns red during a bullish signal, it is a call to exit or take profit without delay.
- If a red downward pointing arrow of the LWMA-Crossover_Signal.ex4 custom indicator forms somewhat above price bars, price is said to be taking a turn, hence the need to exit or take profit.
Sell Entry Rules
Enter a sell position if the following holds true:
- If price breakouts below the trend line as seen on Fig. 1.1, after a sustained support, it is a signal to go short on the designated currency pair.
- If the striped red lines of the MA ribbon filled.89.21 custom indicator forms somewhat above price bars, price is said to be pushed to the downside i.e. a sell signal.
- If the red downward pointing arrow of the LWMA-Crossover_Signal.ex4 custom indicator pops up on the activity chart, it is a straight up sell signal.
Stop Loss for Sell Entry: Place stop loss 2 pips above immediate resistance.
Exit Strategy/Take Profit for Sell Entry
Exit or take profit if the following chart or indicator pattern gets displayed:
- If price retest and breaks above the trend line after a confirmed breakout, it is a trigger to exit or take profit.
- If the striped red lines of the MA ribbon filled.89.21 custom indicator turns lime during a bearish signal, it is a call to exit or take profit without delay.
- If a spring green upward pointing arrow of the LWMA-Crossover_Signal.ex4 custom indicator forms somewhat below price bars when sell orders are live in the market, price is said to be taking a turn, hence the need to exit or take profit.
Sell Trade Example
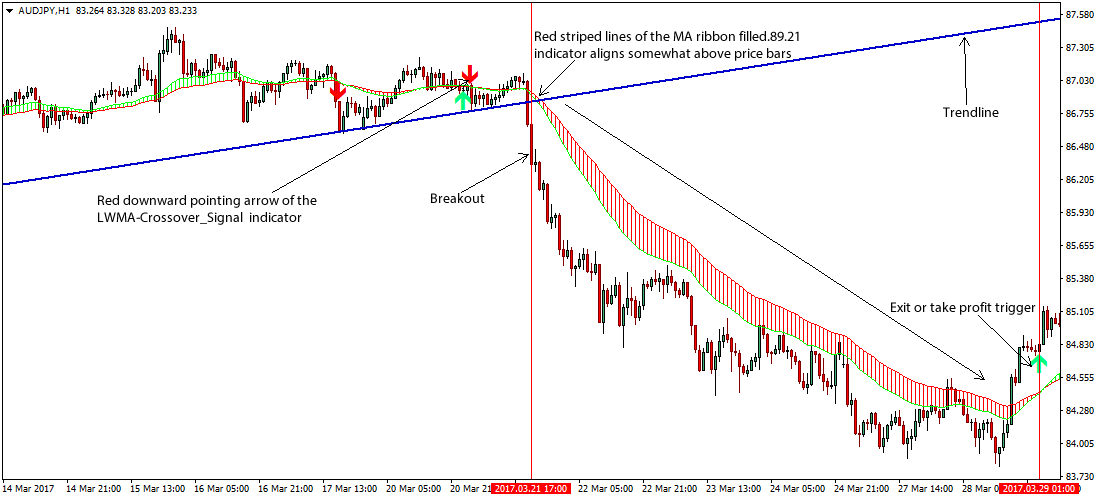
Fig. 1.1
Free Download
Download the Trend Line Break Forex Reversal Strategy
About The Trading Indicators
The MA ribbon filled.89.21 is a custom indicator designed for Metatrader 4 platforms that is based on moving average.
The indicator offers a simple and quick way to determine the trend direction and possible price reversals.
A trend line is a negative or positive slope that is formed by connecting two or more high or low points respectively.
The LWMA-Crossover_Signal.ex4 is a weighted moving average that is computed by multiplying each one of the closing prices within the considered series, by a certain weight coefficient.