
When a break closes above/below a trend channel or to close above/below a critical support or resistance level, a sustained break is said to occur.
The Sustained Break forex trading strategy is a system designed for use on price regardless of if it ranging or follows an uptrend or down trend market.
Chart Setup
MetaTrader4 Indicators: Trendline.ex4, SEFC05.ex4 (default setting), SDX-ZoneBreakout.ex4 (default setting)
Preferred Time Frame(s): 1-Minute, 5-Minute, 15-Minute, 30-Minute, 1-Hour, 4-Hour, 1-Day
Recommended Trading Sessions: Any
Currency Pairs: Any pair
Download
Download the Sustained Break Forex Trading Strategy
Buy Trade Example

Fig. 1.0
Strategy
Long Entry Rules
Enter a buy order if the following indicator or chart pattern gets displayed:
- If price breaks outs above the descending or falling trend line as illustrated on Fig. 1.0, it is an indication that price is driving higher i.e. a buy signal.
- If price breaks above the red dotted line of the SDX-ZoneBreakout.ex4 custom indicator after a breakout above the descending trend line, the sentiment in the market is said to be bullish i.e. a buy signal.
- If the lime bars of the SEFC05 custom indicator forms somewhat below price bars, price is said to be pressured higher i.e. a signal to go long.
Stop Loss for Buy Entry: Place stop loss 3 pips below immediate support.
Exit Strategy/Take Profit for Buy Entry
Exit or take profit if the following holds true:
- If price breaks below the descending or fallen trend line, after witnessing a breakout, it is a signal to exit or take profit at once.
- If price breaks below the red dotted horizontal line of the SDX-ZoneBreakout.ex4 custom indicator, it is a trigger to exit or take profit at once.
- If the SEFC05 custom indicator forms orange bars that are somewhat aligned above the candlesticks, it is a call to exit or take profit without delay (refer to Fig. 1.0).
Sell Entry Rules
Enter a sell order if the following rules or conditions takes precedence:
- If price breaks out below the rising or ascending trend line as illustrated on Fig. 1.1, it is an indication that price is driving lower i.e. a sell signal.
- If price breaks below the green dotted line of the SDX-ZoneBreakout.ex4 custom indicator after a breakout below the descending trend line, the sentiment in the market is said to be bearish i.e. a sell alert.
- If the orange bars of the SEFC05 custom indicator forms somewhat above the candlesticks, price is said to be pushed lower i.e. a signal to go short.
Stop Loss for Sell Entry: Place stop loss 3 pips above immediate resistance.
Exit Strategy/Take Profit for Sell Entry
Exit or take profit if the following holds true:
- If price breaks above the rising or ascending trend line, after witnessing a breakout, it is a signal to exit or take profit at once.
- If price breaks above the green dotted horizontal line of the SDX-ZoneBreakout.ex4 custom indicator during a bearish signal, it is a trigger to exit or take profit at once.
- If the SEFC05 custom indicator forms lime bars during a bearish trend, it is a call to exit or take profit straight away.
Sell Trade Example
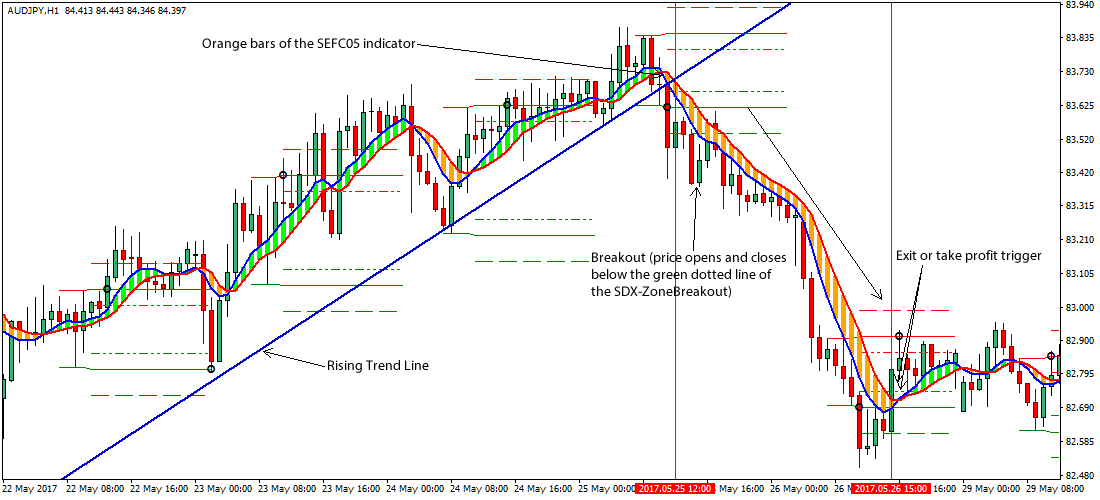
Fig. 1.1
Free Download
Download the Sustained Break Forex Trading Strategy
About The Trading Indicators
The SDX-ZoneBreakout.ex4 custom indicator creates zones of resistance and support within the activity charts, thus spotting possible areas of continuation and reversals in trends.
The SEFC05 custom indicator is a Buy and Sell repaint indicator. The SEFC05 is designed around two moving averages, thus allowing the indicator to smooth price, thereby forming a trend following indicator.
A trend line is a negative or positive slope that is formed by connecting two or more high or low points respectively.