
A breakout is any price drive that pushes the price to move outside of a well-defined support or resistance zone.
The Box Woodies Breakout forex strategy makes it easy for any trader to spot breakouts from well-defined support and resistance zones.
Let’s take a look below how to generate buy and sell signals from this currency trading strategy:
Chart Setup
MetaTrader4 Indicators: WoodiesCCI.ex4 (default settings), 100 EMA.ex4, Trendline.ex4
Preferred Time Frame(s): 1-Minute, 5-Minute, 15-Minute, 30-Minute, 1-Hour, 4-Hour, 1-Day
Recommended Trading Sessions: Any
Currency Pairs: Any pair
Download
Download the Box Woodies Breakout Forex Strategy
Buy Trade Example
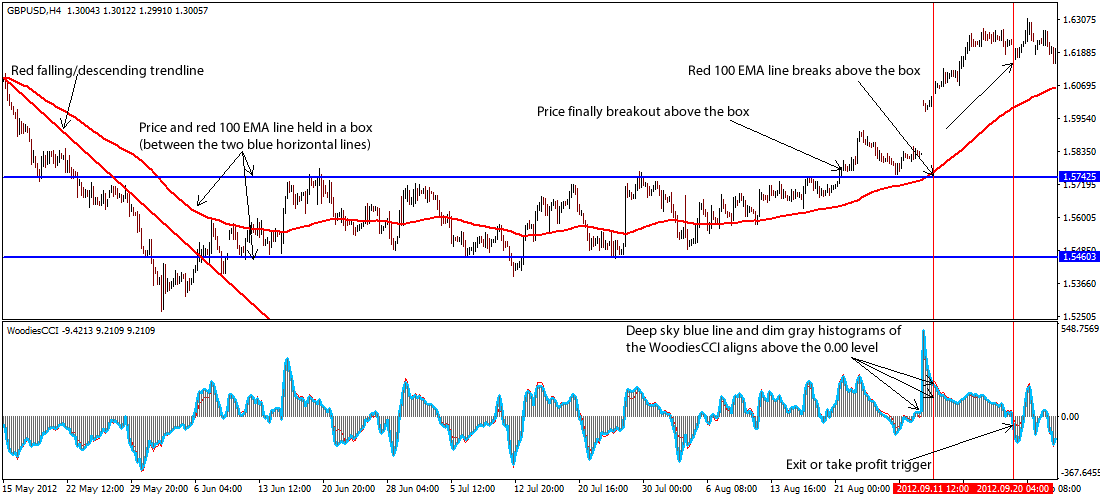
Fig. 1.0
Strategy
Long Entry Rules
Enter a buy order if the following indicator or chart pattern gets displayed:
- If price bars forms within a box after breaking above a falling/descending trendline as seen on Fig. 1.0, it is an indication that price is experiencing consolidation and is preparing for a possible breakout. Hence, if price bars breakout above the box as shown in Fig. 1.0, it is a signal to buy the asset of choice.
- If the 100 EMA indicator breakout above the box as seen on Fig. 1.0, it is a trigger to go long on the currency pair of focus.
- If the deep sky blue line and dim gray histograms of the WoodiesCCI.ex4 custom indicator aligns above the 0.00 level, it is a confirmation of upward price pressures i.e. a signal to buy the designated forex pair.
Stop Loss for Buy Entry: Place stop loss below immediate support.
Exit Strategy/Take Profit for Buy Entry
Exit or take profit if the following rules or conditions are takes precedence:
- If the candlesticks falls below the red line of the 100 EMA while outside the box, it is an indication that price is making a possible U-turn away from its earlier bullish stance, hence an exit or take profit is advised.
- If the deep sky blue line and dim gray histograms of the WoodiesCCI.ex4 realign to form below the 0.00 signal level, it is pointing to diminishing bullish sentiment, hence an exit or take profit is advised.
Sell Entry Rules
Enter a sell order if the following holds sway:
- If price bars forms within a box after breaking below a rising/ascending trendline as shown on Fig. 1.1, it is an indication that price is undergoing consolidation and is getting ready for a possible breakout. Hence, if price bars breakout below the box as shown in Fig. 1.1, it is a signal to sell the selected currency pair.
- If the 100 EMA indicator breakout below the box as illustrated on Fig. 1.1, it is a trigger to go short on the currency pair of interest.
- If the deep sky blue line and dim gray histograms of the WoodiesCCI.ex4 custom indicator aligns below the 0.00 level, it is a confirmation of downward price pressures, hence a trigger to sell the specified forex pair.
Stop Loss for Sell Entry: Place stop loss above immediate resistance.
Exit Strategy/Take Profit for Sell Entry
Exit or take profit if the following takes center stage:
- If the candlesticks rises above the red line of the 100 EMA while outside the box, it is an indication that price is taking a possible U-turn away from its earlier bearish stance, hence an exit or take profit is recommended.
- If the deep sky blue line and dim gray histograms of the WoodiesCCI.ex4 realign to form above the 0.00 signal level, it is pointing to diminishing bearish sentiment, hence an exit or take profit will suffice.
Sell Trade Example
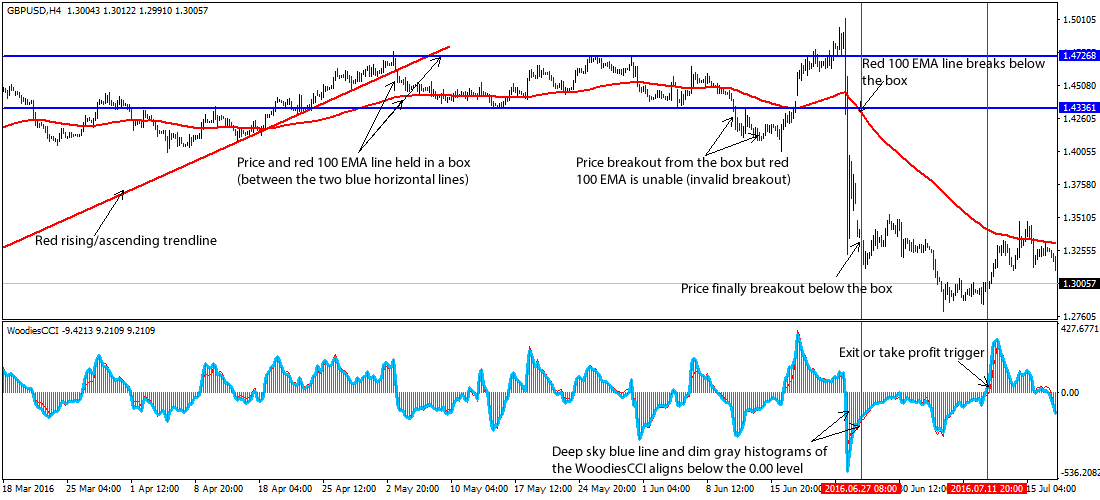
Fig. 1.1
Free Download
Download the Box Woodies Breakout Forex Strategy
About The Trading Indicators
The 100 EMA is an exponential moving average that has its period set at 100 and reduces the lag by adding more weight to recent price.
A trend line is a negative or positive slope that is formed by connecting two or more high or low points respectively.
The WoodiesCCI.ex4 is a momentum indicator that is based on a number of patterns made by the Commodity Channel Index (CCI) indicator.