
There’s a vast amount of information that can be obtained from price action, even so, traders are always pleased to see the correct market trend.
A trading strategy that can catch the trend will always be every trader’s delight and we have designed one that can do just that, with a lot more other fun capabilities.
Learn how the Trend Magic forex strategy works below:
Chart Setup
MetaTrader4 Indicators: Trend Magic.ex4 (default setting), Flat_Trend_RSI.ex4 (default setting)
Preferred Time Frame(s): 1-Minute, 5-Minute, 15-Minute, 30-Minute, 1-Hour, 4-Hour, 1-Day
Recommended Trading Sessions: Any
Currency Pairs: Any pair
Download
Download the Trend Magic Forex Trading Strategy
Buy Trade Example
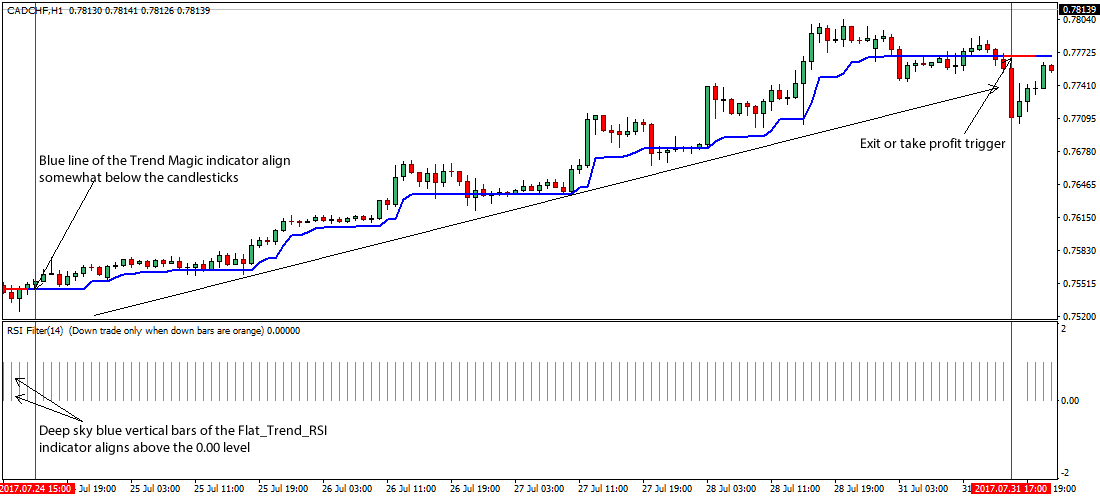
Fig. 1.0
Strategy
Long Entry Rules
Enter a buy order if the following indicator or chart setup is put on display:
- If the blue line of the Trend Magic custom indicator gets drawn somewhat below the candlesticks as depicted on Fig. 1.0, price is said to be taken higher i.e. a signal to go long on the FX pair of interest.
- If the deep sky blue vertical bars of the Flat_Trend_RSI.ex4 custom indicator is seen to be positioned above the 0.00 level (refer to Fig. 1.0), it is a trigger to buy the asset of choice.
Stop Loss for Buy Entry: Place stop loss 5 pips below short-term support.
Exit Strategy/Take Profit for Buy Entry
Exit or take profit if the following rules or conditions take precedence:
- If while a buy trend is ongoing, the line of the Trend Magic custom indicator turns red as seen on Fig. 1.0, an exit or take profit is duly recommended.
- If the Flat_Trend_RSI.ex4 custom indicator displays red vertical bars that are arranged below the 0.00 level, a bearish reversal is said to be looming, hence an exit or take profit will do.
Sell Entry Rules
Take up sell position(s) if the following holds true:
- If the red line of the Trend Magic custom indicator gets plotted somewhat above price bars as illustrated on Fig. 1.1, price is said to be pushed lower i.e. a signal to sell the designated currency pair.
- If the red vertical bars of the Flat_Trend_RSI.ex4 custom indicator gets plotted below the 0.00 level as shown on Fig. 1.1, it is a trigger to sell the specified forex pair.
Stop Loss for Sell Entry: Place stop loss 5 pips above short-term resistance.
Exit Strategy/Take Profit for Sell Entry
Exit or take profit if the following takes center stage:
- If during a sell alert the Trend Magic custom indicator line turns blue as illustrated on Fig. 1.1, it is a signal that points to weaning bears power, hence an exit or take profit is advised.
- If the Flat_Trend_RSI.ex4 custom indicator reverts to deep sky blue vertical bars that are placed above the 0.00 level during a sell signal, a bullish reversal is said to be imminent, hence an exit or take profit will suffice.
Sell Trade Example

Fig. 1.1
Free Download
Download Trend Magic Forex Trading Strategy
About The Trading Indicators
The Flat Trend RSI is an enhanced Relative Strength Indicator that has its default period set to 14.
The Trend Magic custom indicator is a trend following indicator that combines both the CCI and the ATR indicators.