
Traders will do anything in their power to always follow the market trend, as this has remained a proven way of generating massive returns when trading online currencies.
The Flat Trend Profit forex trading strategy is a well-designed enhanced RSI strategy that allows FX traders plug into the market, with guarantees of cyclical profits on any timeframe.
Chart Setup
MetaTrader4 Indicators: doubletrendprofit.ex4 (Inputs Variable Modified; SignalPeriod1=15, SignalPeriod2=18, Line2Down=Yellow), Flat_Trend_RSI.ex4 (Inputs Variable Modified; PeriodRSI=6)
Preferred Time Frame(s): 1-Minute, 5-Minute, 15-Minute, 30-Minute, 1-Hour, 4-Hour, 1-Day
Recommended Trading Sessions: Any
Currency Pairs: Any pair (preferred low spread pairs such as EUR/USD and USD/JPY)
Download
Download the Flat Trend Profit Forex Trading Strategy
Buy Trade Example

Fig. 1.0
Strategy
Long Entry Rules
Enter a buy position if the following chart or indicator setup gets put on display:
- If the lines of the doubletrendprofit.ex4 custom indicator intersect in a manner where the thicker blue line is aligned somewhat below the other indicator line and price bars as well, then it is okay to recommend initiating buy position(s).
- If the vertical deep sky blue bars of the Flat_Trend_RSI.ex4 custom indicator take position above the 0.00 level as illustrated on Fig. 1.0, a buy entry is said to be most likely favored.
Stop Loss for Buy Entry: Place stop loss 1 pip below support.
Exit Strategy/Take Profit for Buy Entry
Exit or take profit if the following rules or conditions take precedence:
- If the thicker blue line of the doubletrendprofit.ex4 custom indicator turns yellow during a bullish trend, it is pointing to weaning bull power in the market, hence a trigger to exit or take profit at once.
- If while a buy signal is ongoing and the Flat_Trend_RSI.ex4 custom indicator displays a red vertical bar that is positioned below the 0.00 level as depicted on Fig. 1.0, an exit or take profit is recommended.
Sell Entry Rules
Enter a sell order if the following holds true:
- If the lines of the doubletrendprofit.ex4 custom indicator intersect in a manner where the thicker yellow line is aligned somewhere above the other indicator line and price bars as well, then it is appropriate to say a sell trigger is looming.
- If the vertical red bars of the Flat_Trend_RSI.ex4 custom indicator get aligned below the 0.00 level as shown on Fig. 1.1, it is a trigger to sell the stipulated currency pair.
Stop Loss for Sell Entry: Place stop loss 1 pip above resistance.
Exit Strategy/Take Profit for Sell Entry
Exit or take profit if the following takes center stage:
- If the thicker yellow line of the doubletrendprofit.ex4 custom indicator turns blue when a sell is running in the market, it is indicative of halting bears pressures, hence an exit or take profit will do.
- If while a sell signal is ongoing and the Flat_Trend_RSI.ex4 custom indicator displays a deep sky blue vertical bar that is placed above the 0.00 level as seen on Fig. 1.1, an exit or take profit is advised.
Sell Trade Example
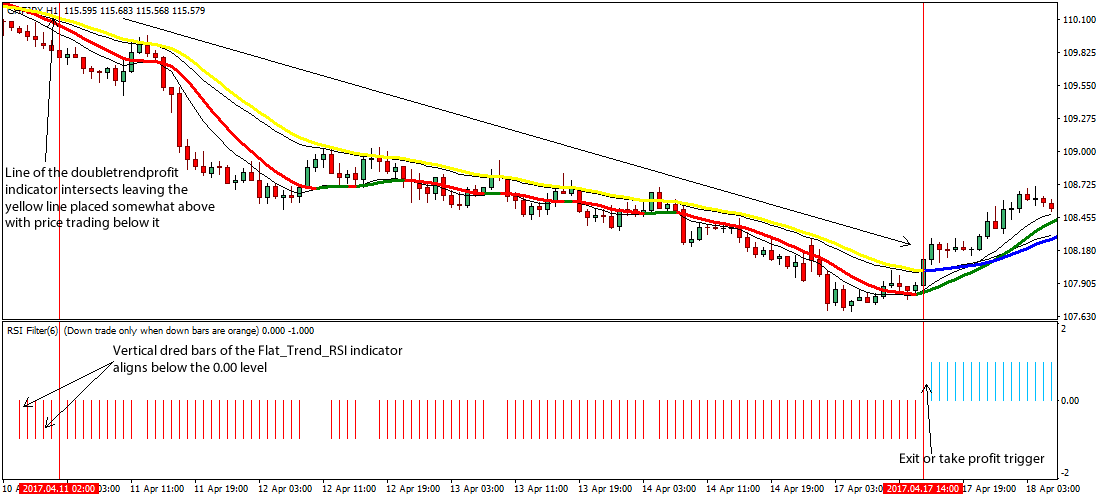
Fig. 1.1
Free Download
Download Flat Trend Profit Forex Trading Strategy
About The Trading Indicators
Flat Trend RSI is an enhanced Relative Strength Indicator that has its default period set to 14.
The doubletrendprofit.ex4 custom indicator is composed of moving averages set at varying period.
The lines intersect to yield bullish/bearish alerts as exemplified above.