
The Donchian 2xCCI Channels forex trading strategy can be unleashed on the currency markets just by anyone who desires to spot buy/sell trading opportunities in a unique and safe manner.
All that is required of you is to master the setups, watch them replicate on the activity chart and further open positions in response to them.
Chart Setup
MetaTrader4 Indicators: DoubleCCI_Woodies.ex4 (Inputs Variable Modified; Trendcci_Period=36), DonchianChannels.ex4 (Inputs Variable Modified; BarsToCount=39)
Preferred Time Frame(s): 1-Minute, 5-Minute, 15-Minute, 30-Minute, 1-Hour, 4-Hour, 1-Day
Recommended Trading Sessions: Any (24 hour trading)
Currency Pairs: Any pair
Download
Download the Donchian 2xCCI Channels Forex Trading Strategy
Buy Trade Example

Fig. 1.0
Strategy
Long Entry Rules
Enter a buy position if the following indicator or chart setup gets displayed:
- If the blue line along with the green & gold histograms of the DoubleCCI_Woodies.ex4 custom indicator breaks and stays above the 0.00 level (refer to Fig. 1.0), it is an indication of upward price pressures i.e. a trigger to go bullish on the asset of choice.
- If price closes above the blue middle line of the DonchianChannels.ex4 custom indicator and trades somewhat around the red outer upper band as seen on Fig. 1.0, it is a call to buy the specified currency pair.
Stop Loss for Buy Entry: Place stop loss 5 pips below the blue line or support.
Exit Strategy/Take Profit for Buy Entry
Exit or take profit if the following rules or conditions takes precedence:
- If the blue line of the DoubleCCI_Woodies.ex4 custom indicator falls below the 0.00 level while a buy signal is running, it is a signal that points to weaning upward price pressures, hence an exit or take profit will do.
- If price closes below the middle blue line of the DoubleCCI_Woodies.ex4 custom indicator during an uptrend, it is a prompt alert to exit or take profit accordingly.
Sell Entry Rules
Enter a sell order if the following holds true:
- If the blue line along with the red & gold histograms of the DoubleCCI_Woodies.ex4 custom indicator breaks and stays below the 0.00 level as shown on Fig. 1.1, it is an indication of downward price pressures i.e. a trigger to sell the fx pair of focus.
- If price closes below the blue middle line of the DonchianChannels.ex4 custom indicator and trades fairly around the green outer lower band as seen on Fig. 1.1, it is a trigger to sell the designated currency pair.
Stop Loss for Sell Entry: lace stop loss 5 pips above the blue line or resistance.
Exit Strategy/Take Profit for Sell Entry
Exit or take profit if the following takes center stage:
- If the blue line of the DoubleCCI_Woodies.ex4 custom indicator spikes above the 0.00 level during a bearish market, it is a signal that points to halting downward price pressures, hence an exit or take profit will do.
- If price closes above the middle blue line of the DoubleCCI_Woodies.ex4 custom indicator during a downtrend, it is a trigger to exit or take profit forthwith.
Sell Trade Example
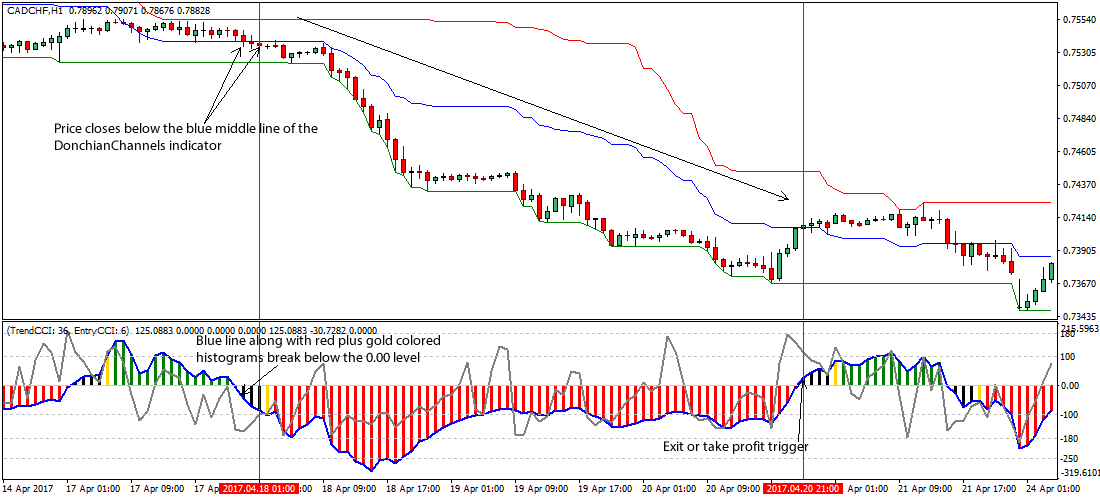
Fig. 1.1
Free Download
Download the Donchian 2xCCI Channels Forex Trading Strategy
About The Trading Indicators
The DoubleCCI_Woodies.ex4 custom indicator is designed on two CCI, hence it is a momentum indicator.
As such the indicator is tailored to allow traders spot when a market is overbought or oversold, and it is expected to see a directional reversal and retracement.
The DonchianChannels.ex4 is a technical study that was created by Richard Donchian and has the core aim of measuring volatility in the market.
The bands tend to expand with increased volatility and contracts when volatility decreases.