So many online currency traders wish to know the combination of indicators that will serve them best in the market, the answer to this question is relative due to sheer number out there.
We took out time to put together a combination of technical studies which proved profitable on all timeframes.
The forex indicator trading strategy combines two really amazing indicators and it offers a really simple setup for profitable trend recognition.
Chart Setup
MetaTrader4 Indicators: Ind-GG01.ex4 (Input Variable Modified; period_ma=10, period_ca=10, period_boll=28), GG-RSI-CCI.ex4 (Input Variable Modified; Avg_Period1=16, Avg_Period2=28, Ind_Period=40)
Preferred Time Frame(s): 1-Minute, 5-Minute, 15-Minute, 30-Minute, 1-Hour, 4-Hour, 1-Day
Recommended Trading Sessions: Any
Currency Pairs: Any pair
Download
Download the Forex Indicator Trading Strategy
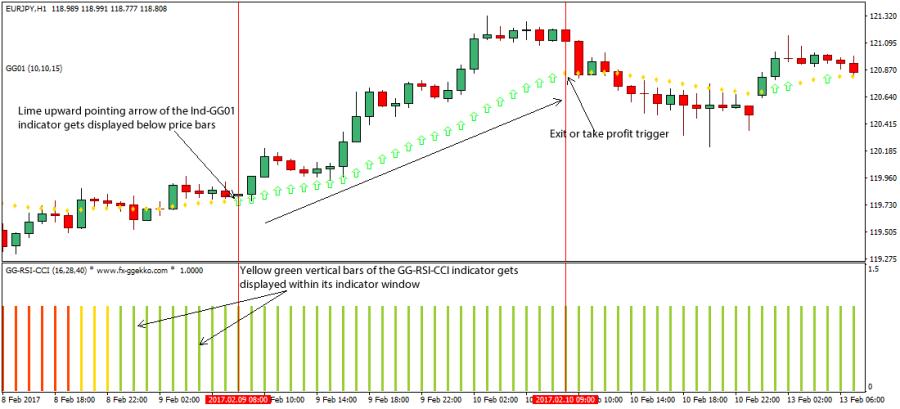
Buy Trade Example
Fig. 1.0
Strategy
Long Entry Rules
Initiate a buy entry if the following indicator or chart pattern gets displayed:
- If the lime upward pointing arrow of the Ind-GG01 custom MT4 indicator gets placed slightly below the candlesticks as seen on Fig. 1.0, the prevalent market sentiment is said to be bullish i.e. a trigger to buy the desired forex pair.
- If the yellow green vertical bars of the GG-RSI-CCI custom indicator gets aligned within the indicator window as illustrated on Fig. 1.0, price is said to be pushed to the upside i.e. a trigger to buy the stipulated currency pair.
Stop Loss for Buy Entry: Place stop loss 1 pip below medium-term support level.
Exit Strategy/Take Profit for Buy Entry
Exit or take profit if the following rules or conditions takes precedence:
- If the gold rhombus shaped objects of the Ind-GG01 custom indicator pops up on the activity chart as shown on Fig. 1.0, it is an indication of an imminent bearish reversal, hence an exit or take profit will suffice.
- If the orange red vertical bars of the GG-RSI-CCI custom indicator pops up within the indicator window during a buy signal, more bulls are said to be exiting their positions, as such an exit or take profit is recommended.
Sell Entry Rules
Enter a sell order if the following holds sway:
- If the gold rhombus shaped object-like bodies of the Ind-GG01 custom indicator gets displayed on the activity chart as seen on Fig. 1.1, price is said to be pressured lower, hence a trigger to sell the currency pair of interest.
- If the orange red vertical bars of the GG-RSI-CCI custom indicator gets aligned within the indicator window as depicted on Fig. 1.1, the sentiment in the market is said to be bearish i.e. a trigger to sell the designated forex pair.
Stop Loss for Sell Entry: Place stop loss 1 pip above medium-term resistance level.
Exit Strategy/Take Profit for Sell Entry
Exit or take profit if the following takes center stage:
- If the lime colored upward pointing arrow of the Ind-GG01 custom indicator pops up on the activity chart as shown on Fig. 1.1, bear pressures is said to be weaning in the market, hence an exit or take profit is advised.
- If the yellow green vertical bars of the GG-RSI-CCI custom indicator gets displayed within the indicator window during a bears market, it is a trigger to exit or take profit at once.
Sell Trade Example
Fig. 1.1
Free Download
Download the Forex Indicator Trading Strategy
About The Trading Indicators
The Ind-GG01 custom indicator gives you buy or sell signal.
It uses Moving Averages, Parabolic SAR, Bollinger Bands and i-CAi in doing this.
The GG-RSI-CCI custom indicator defines a combination of other dominant technical indicators i.e. CCI, RSI etc.
Its design allows for it to determine the major currency trend.
The yellow green bars represents an uptrend, orange red bars signifies downtrend, while ranging market is denoted by gold colored bars.


