
The Forex Signals Channel trading strategy identifies the real market trend easily and helps to setup accurate buy and sell trade setups on any currency pair of your choice.
Learn and download this versatile strategy for free below:
Chart Setup
MetaTrader4 Indicators: ChandeQStik_v1.ex4 (Inputs Variable Modified; Length=50, MA_Mode=2), channel-trading-signals.ex4 (default setting)
Preferred Time Frame(s): 1-Minute, 5-Minute, 15-Minute, 30-Minute, 1-Hour, 4-Hour, 1-Day
Recommended Trading Sessions: Any
Currency Pairs: Any pair
Download
Download the Forex Signals Channel Trading Strategy
Buy Trade Example
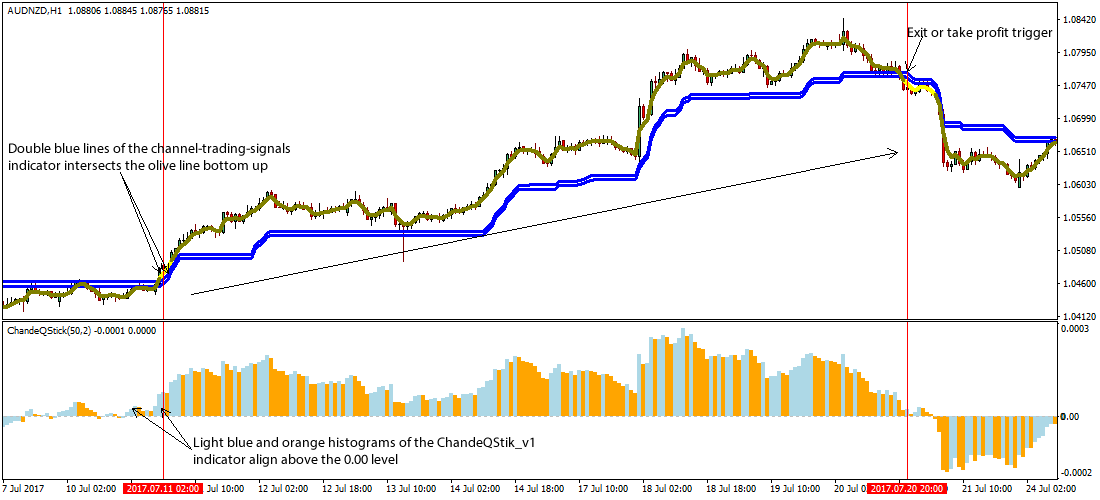
Fig. 1.0
Strategy
Long Entry Rules
Enter a buy position if the following chart or indicator setup gets displayed:
- If the double blue lines of the channel-trading-signals custom indicator intersects the olive line bottom up (refer to Fig. 1.0), price is said to be pushed to the upside i.e. a trigger to buy the stipulated forex pair.
- If the light blue and orange histograms of the ChandeQStik_v1 custom indicator get aligned above the 0.00 level as shown on Fig. 1.0, the sentiment in the market is said to bullish i.e. a trigger to buy the specified fx pair.
Stop Loss for Buy Entry: Place stop loss below the double blue rising line.
Exit Strategy/Take Profit for Buy Entry
Exit or take profit if the following rules or conditions are upheld:
- If price closes below the double blue lines of the channel-trading-signals custom indicator, it is a pointer to a likely halting of bulls power in the market, as such an exit or take profit is advised.
- If the histograms of the ChandeQStik_v1 custom indicator readjust to form below the 0.00 level, it is an exit or take profit trigger.
Sell Entry Rules
Initiate a sell order in the market if following holds true:
- If the double blue lines of the channel-trading-signals custom indicator intersects the olive line in a top downward fashion as seen on Fig. 1.1, price is said to be pressured lower, hence a sell alert if appropriate.
- If the light blue and orange histograms of the ChandeQStik_v1 custom indicator forms below the 0.00 level as depicted on Fig. 1.1, the sentiment in the market is said to bearish i.e. a trigger to sell the stated fx pair.
Stop Loss for Sell Entry: Place stop loss above the double blue falling line.
Exit Strategy/Take Profit for Sell Entry
Exit or take profit if the following takes center stage:
- If price closes above the double blue lines of the channel-trading-signals custom indicator, it is a pointer to a probable weaning of bearish market sentiment, hence an exit or take profit is recommended.
- If the histograms of the ChandeQStik_v1 custom indicator realigns to form above the 0.00 level when a sell signal is ongoing, an exit or take profit is thus advised.
Sell Trade Example
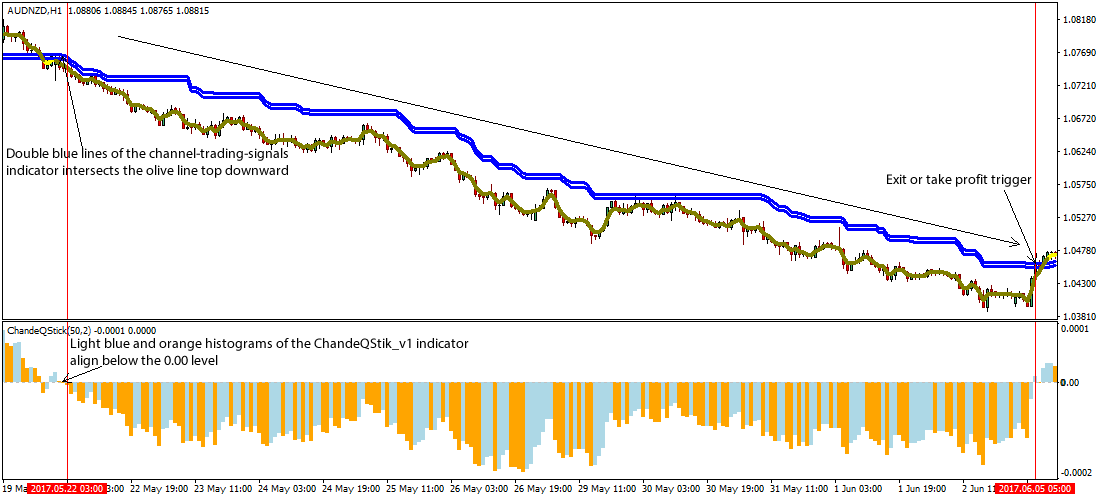
Fig. 1.1
Free Download
Download the Forex Signals Channel Trading Strategy
About The Trading Indicators
The ChandeQStik_v1.ex4 indicator for MT4 is a brainchild of Tushar Chande, designed to define the strength and weakness of a security over ‘n’ period of time.
The Qstick indicator typifies the moving average of the difference between the security’s opening and closing price.
The channel-trading-signals.ex4 custom indicator is a moving average indicator that can be used to measure the trend.